Global Commodity Reports
Get ahead of the market with Helios reports forecasting commodity prices, identifying climate risk, and monitoring trends on a global scale for over 50+ commodities.
Global Commodity Reports
Our proprietary data enables you to strategically source from the best-performing regions before the market catches on.
Price Forecasting and Historical Price Series
With 400+ price forecasts and historical price data going back to 2020, our reports predict prices out 12 months, including what’s driving the price.
Futures Forecasting & Trade Signals
Powered by our cutting-edge AI platform, we help predict large shifts in futures prices for exchange-traded commodities weeks, and even months, in advance with up to 90% accuracy.
Catastrophe Tracking & Breaking News
Scraping 1,000,000+ news articles across the globe daily, stay up-to-date with important insights regarding production, harvest, exports, imports, natural disasters, and more.
Superior World Coverage
We cover over 90% of the regions globally that grow each commodity, with daily data uploads and climate risk, weather, and price forecasting for the next 12 months.
Growing Season Analysis
Our reports conduct full growing season analysis and predictions for soft commodities, equipped with seasonal risk ratings, yield ratings, and comparisons to historical averages.
Climate Risk Tracking & Predictions
Utilizing dozens of custom machine-learning models, our reports identify which countries are at highest risk and what key weather inputs (precipitation, temperature, etc) are causing the risk.
See the power of our Global Commodity Reports (GCRs) for yourself
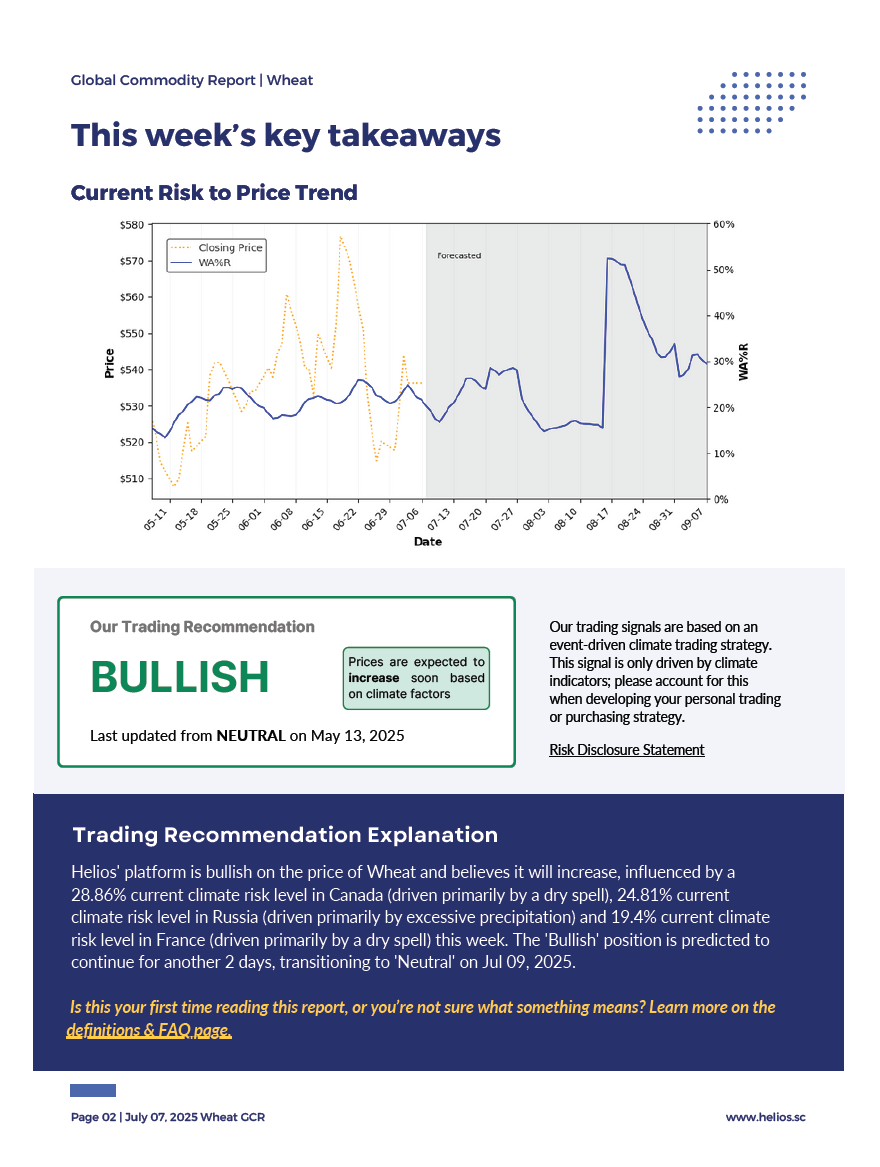
We know our reports are the most predictive in the industry. Read through examples of actual reports below!
Capitalize on Spot Market Opportunities
Gain the unparalleled ability to anticipate and leverage spot market opportunities with our cutting-edge insights. Our advanced analytics empower you to make informed decisions weeks ahead of your competitors, providing a significant advantage in the fast-paced market landscape.
Helios Question-of-the-Day:
What the heck is a WA%R?
Predicting price fluctuations in commodity markets is a daunting task - so much so that we had to create our own acronym! Our global commodity reports (GCRs) feature a first-of-its-kind metric: the WA%R™.
WA%R™ stands for Weighted Average Percentage of Risk. So, what exactly does that mean? Well, the WA%R™ is calculated through the total number of locations that Helios has deemed high-risk over the total number of locations in the global export market.
The larger the WA%R™, the more likely a price shift is coming to your commodity. Using the WA%R™ is one of the best ways to gauge the effects of climate change, bad weather, and critical events on price.
And you can only find it in our Global Commodity Reports.
API and Excel Plugins for quant traders
Enhance your analysis and enhance model effectiveness using our user-friendly API and Excel Plugin options.
Our climate, critical event, and economic data seamlessly integrate into your existing workflow for data analysis, enabling your business to minimize time spent organizing data and focus more on leveraging it to enhance decision-making processes.


